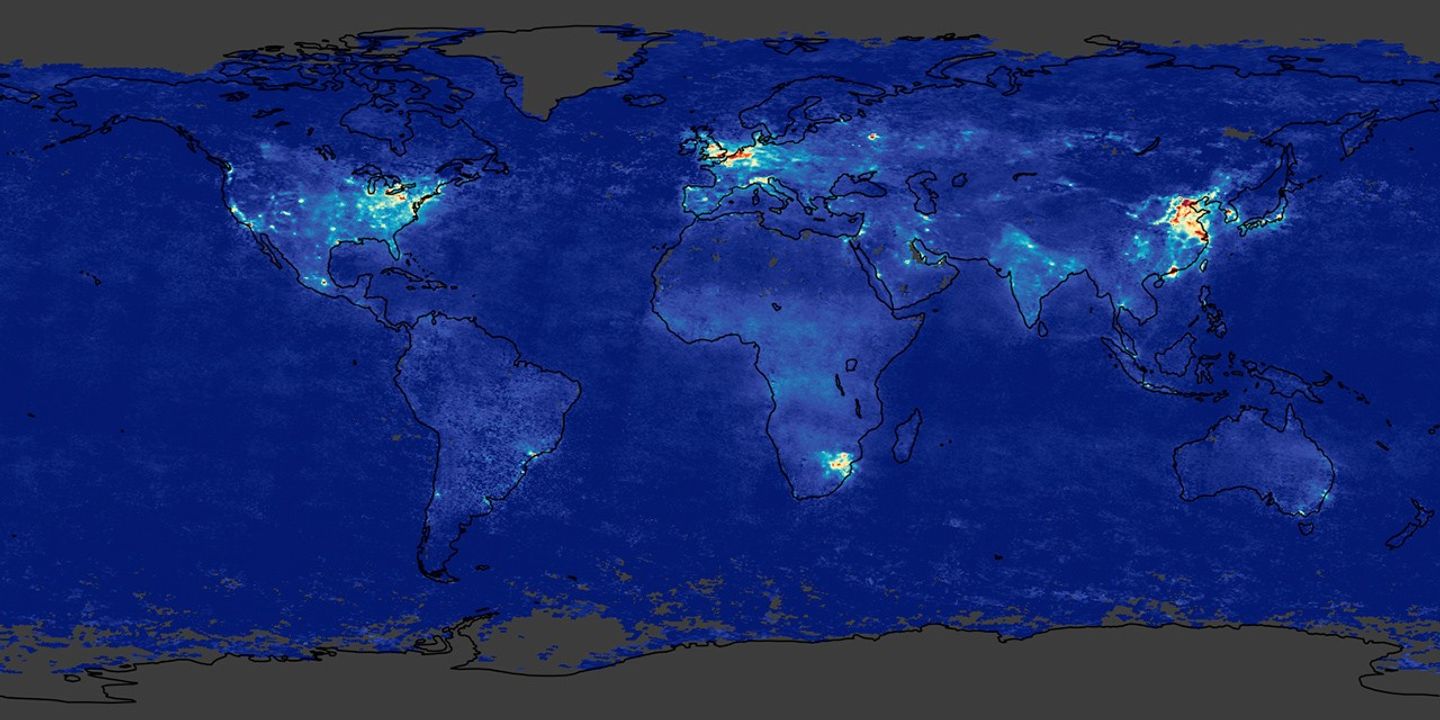
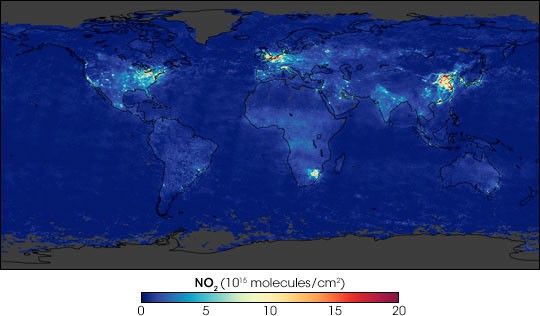
This image shows a global map of nitrogen dioxide (NO2) in the troposphere (lower atmosphere) in 2003, prepared using data collected by the Scanning Imaging Absorption Spectrometer for Atmospheric Chartography (SCIAMACHY) instrument aboard the European Space Agency’s Envisat satellite and averaged over the entire year. NO2 (along with other Nitrogen oxides) is a highly reactive gas that is one of the six common air pollutants monitored by the U.S. Environmental Protection Agency (EPA). The primary sources of NO2 are motor vehicles, electric utilities, and other industrial, commercial, and residential sources that burn fuels.
The principal sources of NO2 in this image are large, populous urban areas. In addition, heavily industrialized areas, and even individual power plants, are sources of the gas. Biomass burning produces lower concentrations of NO2 that are typically spread over wide areas.
References & Resources
Image by Robert Simmon, based on data provided by the Tropospheric Emission Monitoring Internet Service ( TEMIS )